Delegate Demographics at a Glance
Our Conferences in numbers
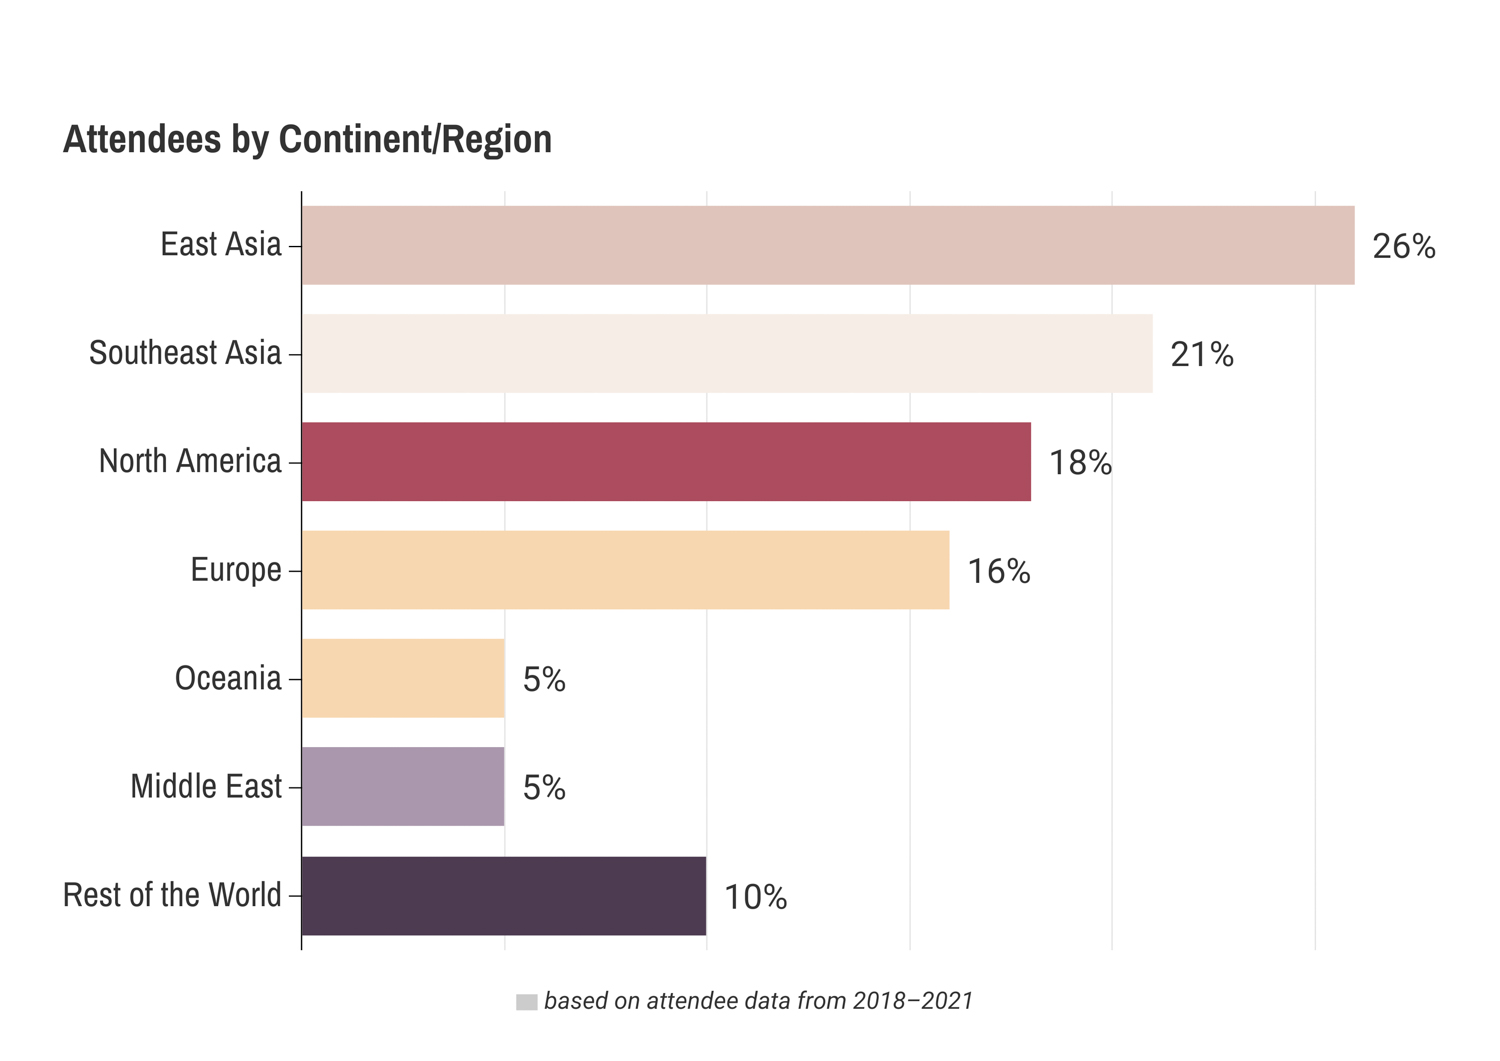
- 45,000 attendees
- 115 countries
- 54% higher education faculty members
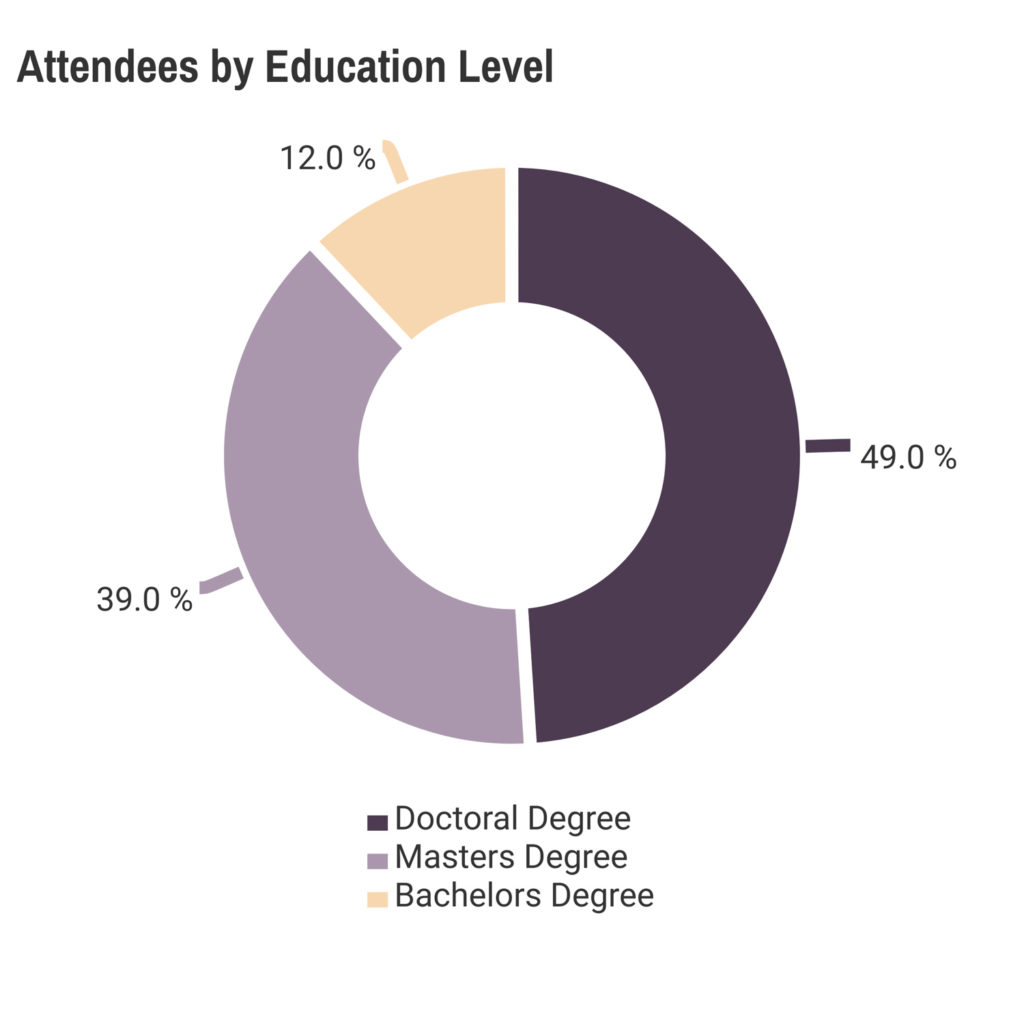
- 49% hold a PhD or other terminal degree
- 26% PhD or postgraduate students
Since our first conference in 2009, more than 45,000 delegates have attended our annual interdisciplinary events. Our conferences attract attendees representing 115 countries – truly international events. This diversity serves as a wonderful comparative and contrastive resource.
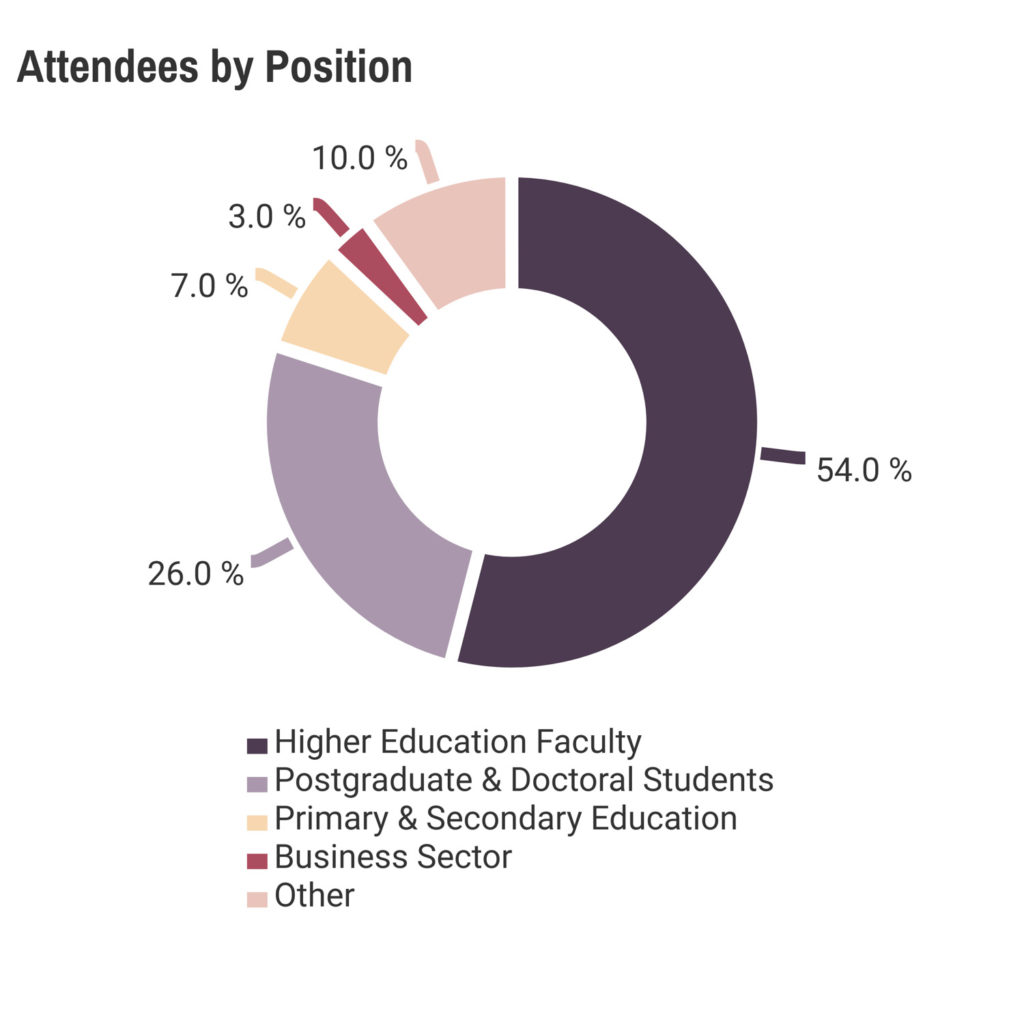
The majority of conference attendees are higher education faculty, with 54% holding an academic post. At 26% of the total registered delegates, postgraduate and doctoral students make up the next largest group of attendees. The remaining attendees come from the business sector (3%) and from the field of primary & secondary education (7%), with 10% registered as "other".
(Source: 2018–2021 Conference Registration Data)
You must be logged in to post a comment.